Dashboard
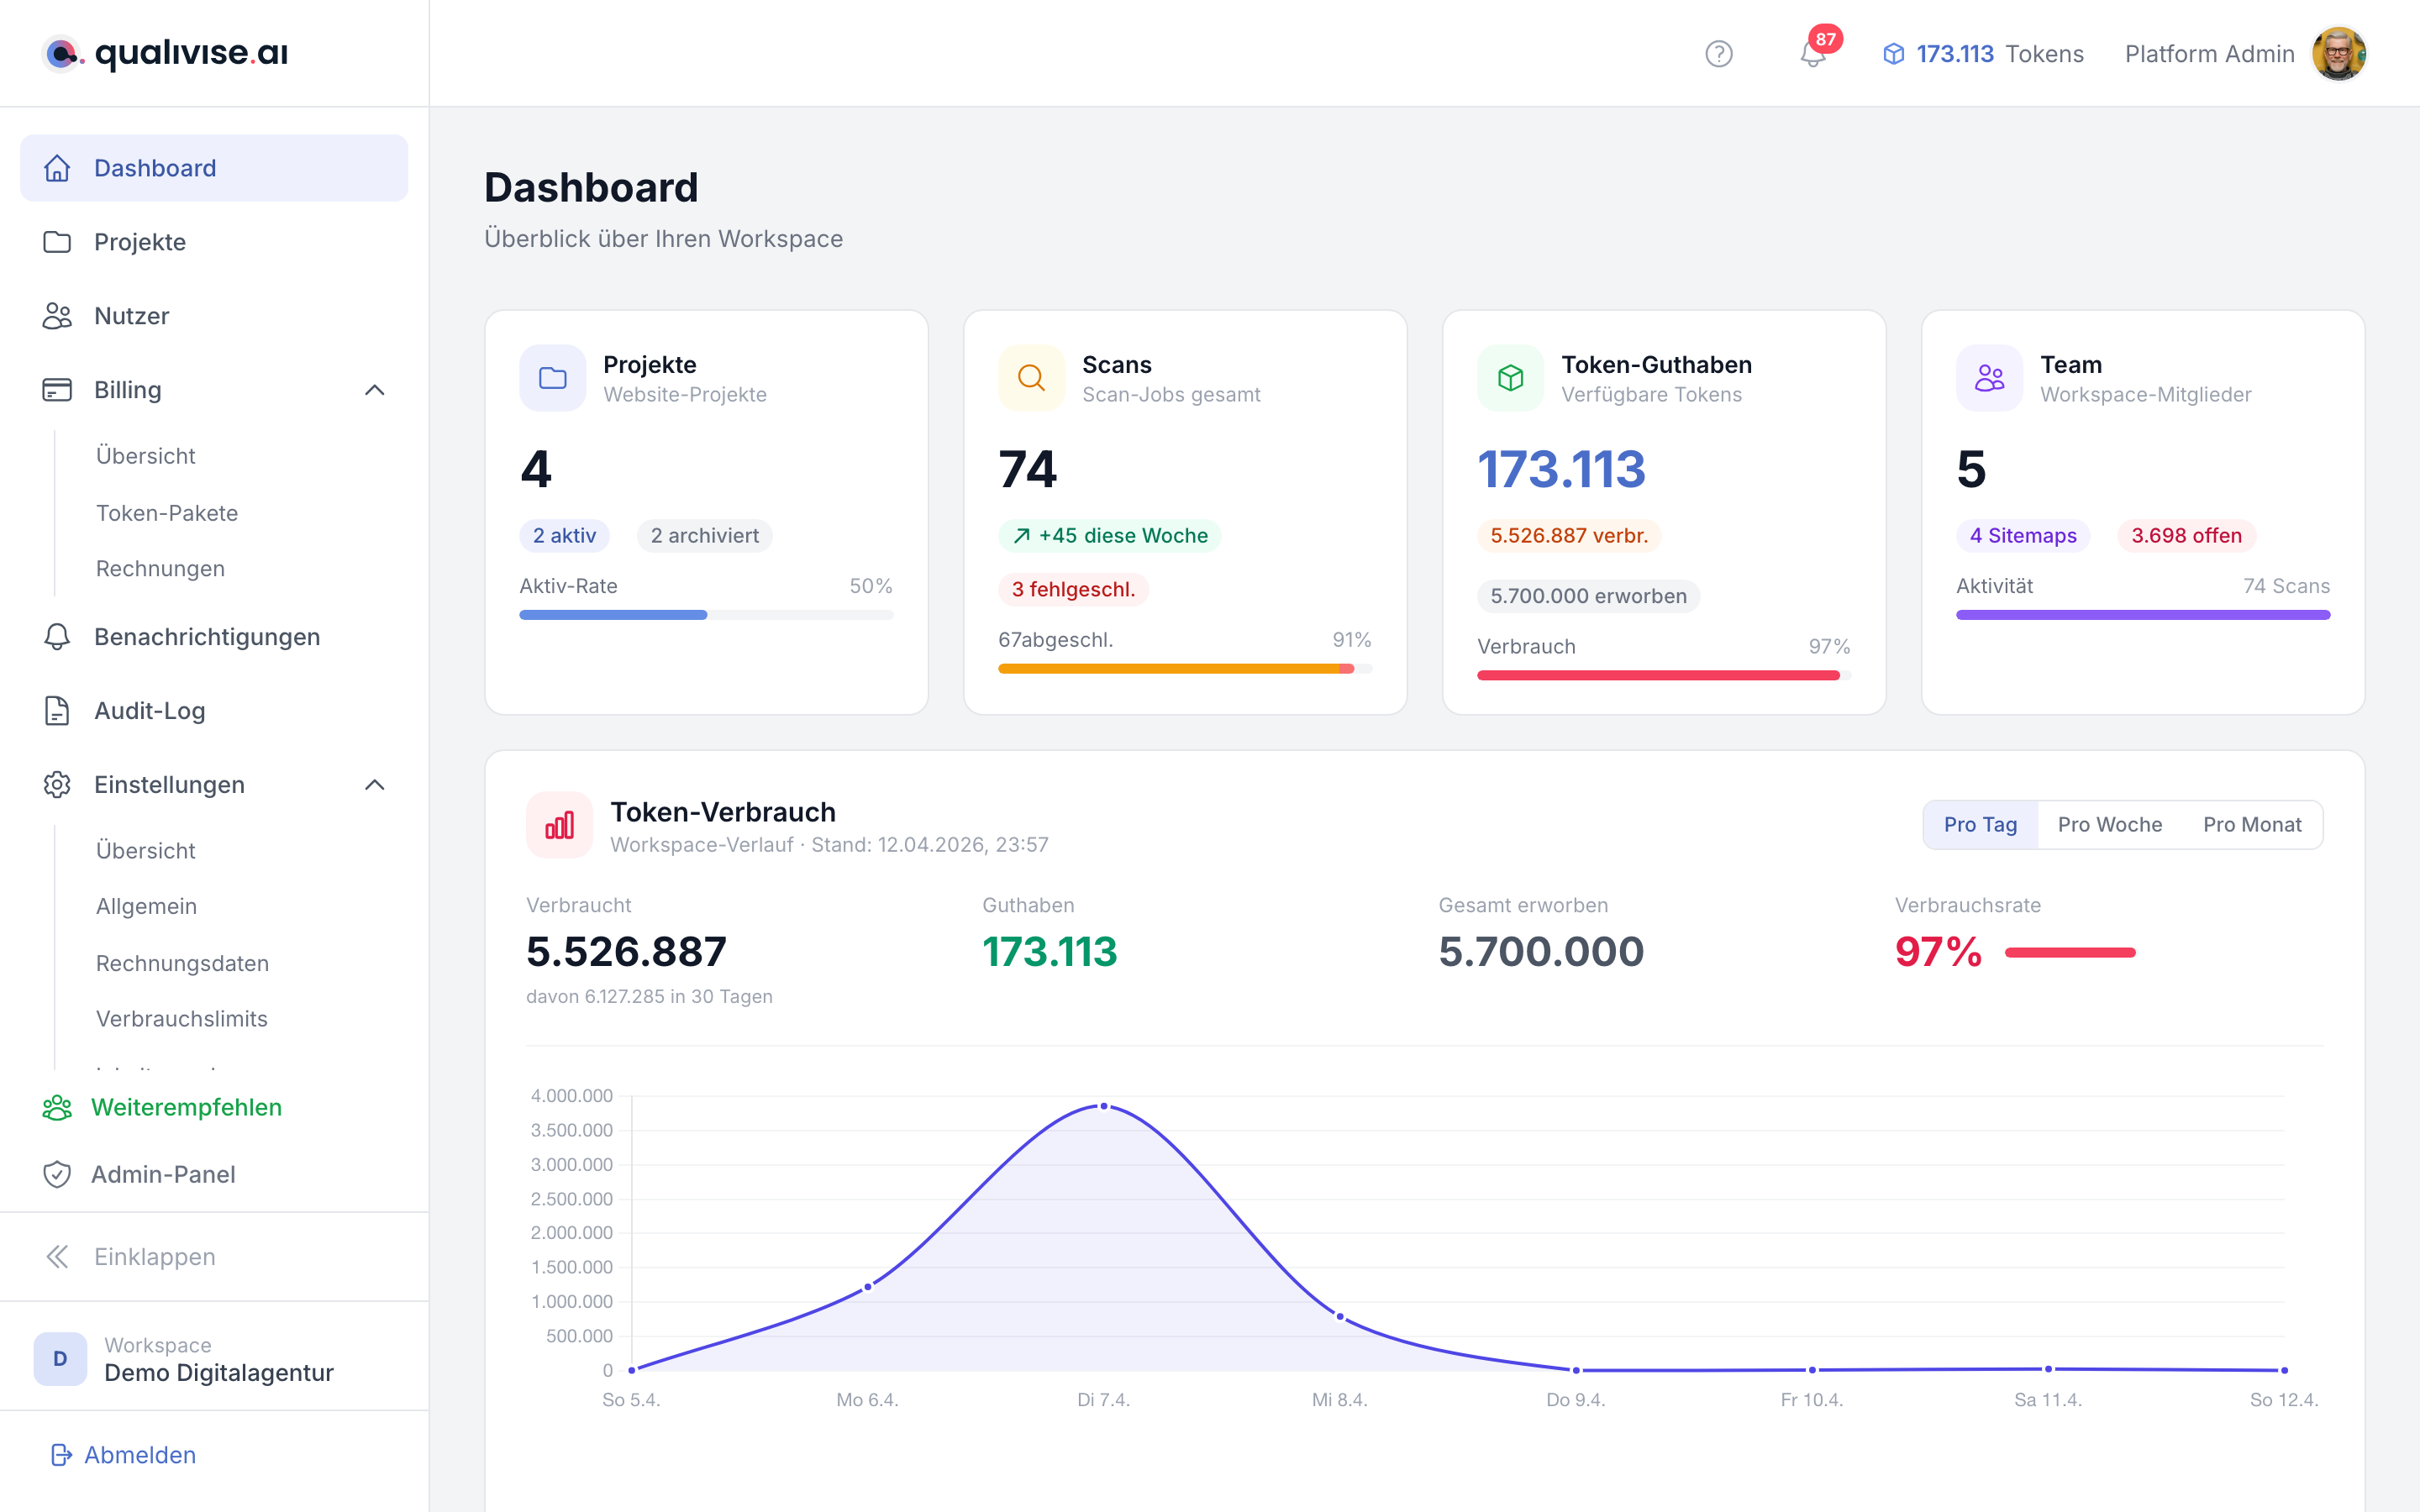
The dashboard is your landing page after login. At a glance it shows you the state of projects, scans, tokens and your team - including token-consumption history, current projects and handy quick actions. This way you spot bottlenecks early without opening every area individually.
Full overview
- Central starting point right after sign-in.
- Top row with four KPI cards, below it the token consumption area with a chart.
- Further down: onboarding checklist (for new workspaces), recent token purchases, current projects and quick actions.
KPI cards in the top row
The four cards summarise key metrics. Each card has a main value, optional badges with additional information and a footer with a compact visualisation.
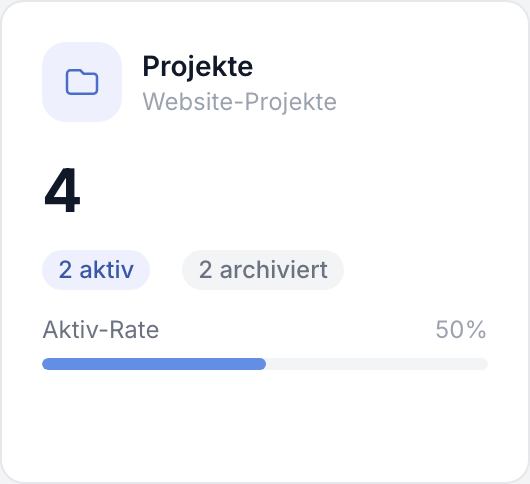
Projects
Total number of all projects (active + archived). Active and Archived badges. Shows the active rate as a percentage bar - a high value means most projects are actively in use.
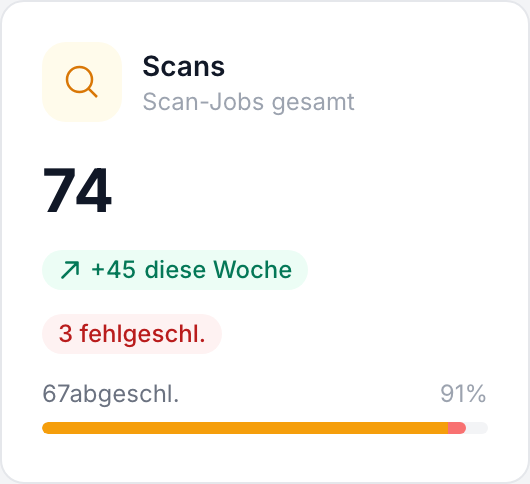
Scans
Total number of scan jobs in the workspace. Badges show new scans this week, running and failed jobs. A multi-segment bar shows the distribution: amber (completed), blue (running), red (failed). A lot of red points to queue or configuration issues.
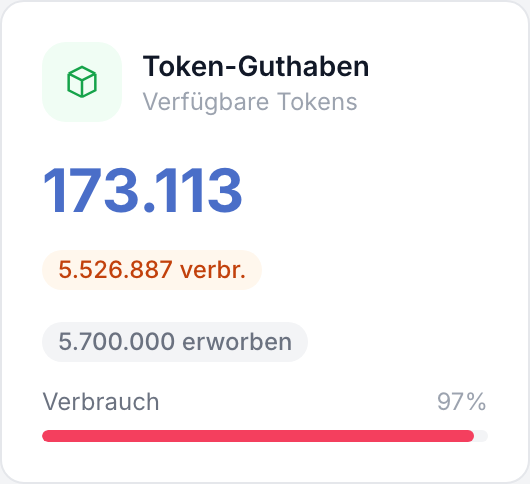
Token balance
Your current balance - tokens ready to use. Badges for consumed and purchased tokens. The consumption rate as a colour-coded percentage: green (< 50 %), amber (50-80 %), rose (> 80 % - risk of interruptions).
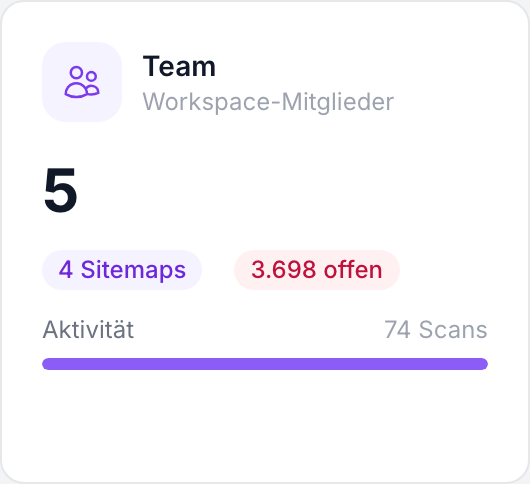
Team
Number of all workspace members. Badges for sitemaps and open findings. Activity as scan count - a rough workspace pulse.
Token consumption
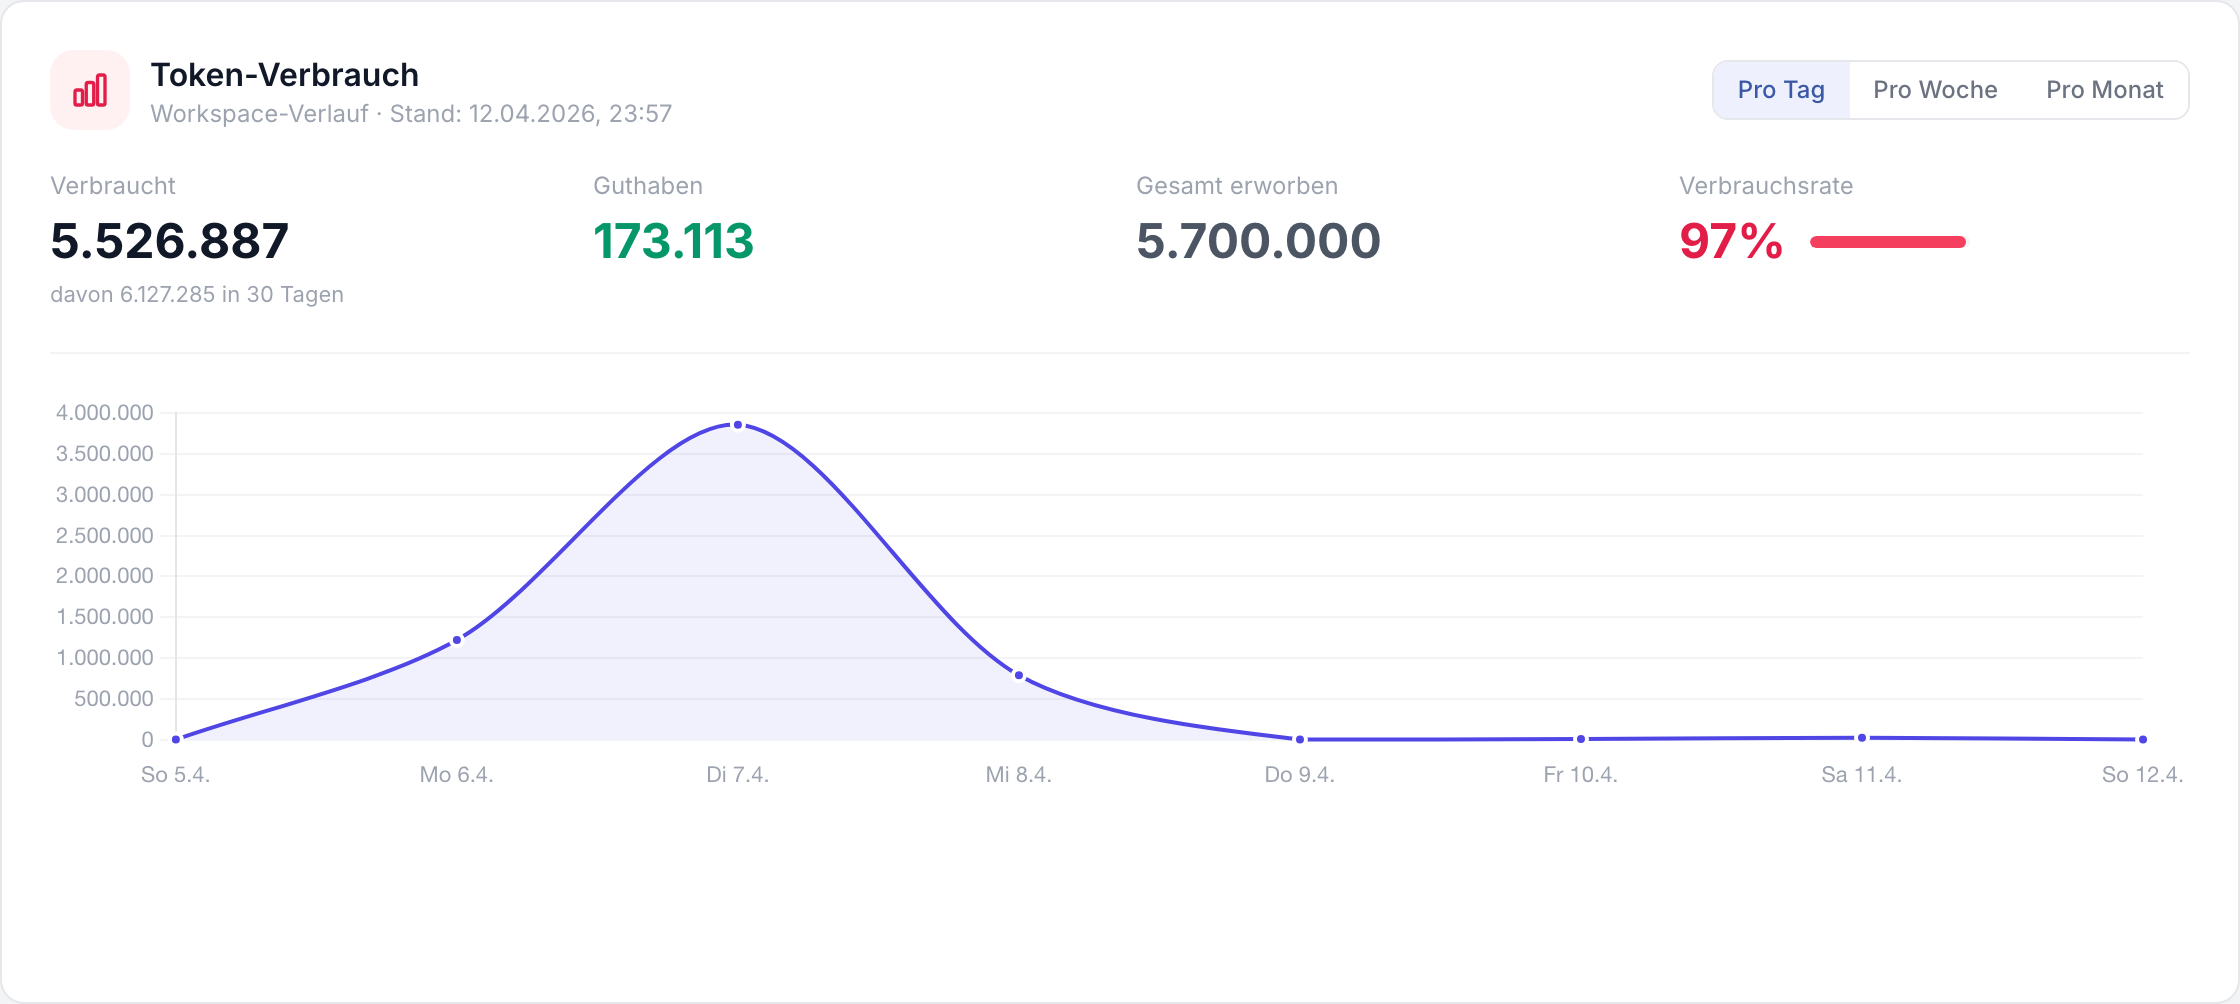
The token consumption section shows how your balance and consumption develop over time.
- Subtitle:
Workspace history - as of: {datetime}- the timestamp refers to the state of the aggregated data.
Granularity
Use the buttons to choose the granularity of the chart:
- Per day - finest resolution, good for short periods and detailed peaks.
- Per week - balanced overview for the last few weeks.
- Per month - long-term trend, good for billing and budget conversations.
KPI row below the chart
Below the granularity selector you will find these metrics in a single row:
| Metric | Meaning |
|---|---|
| Consumed | Tokens used in the selected period. |
| Balance | Current balance. |
| Total acquired | Sum of all tokens acquired. |
| Consumption rate | Ratio of consumption to total volume acquired, in %. |
Chart
- A single line labelled Total with a filled area in indigo.
- Steep increases = lots of consumption in a short time, flat lines = quiet phase.
Onboarding checklist
For new users and fresh workspaces the onboarding checklist appears. It guides you through the most important initial setup steps (e.g. profile, first project, sitemap, scan profile).
- Open steps are clearly visible; completed steps can be ticked off.
- After completion you can hide the checklist - this does not remove any data and does not block any features.
Recent token purchases
The recent token purchases table lists the last five purchases or credits (date, package, amount, status).
- Quick reconciliation with accounting or an internal ticket.
- For the full purchase history switch to the Billing section.
Current projects
Up to five current projects are shown with a progress bar towards findings.
- Use the list to jump directly into the project that needs the most attention right now.
- Stagnating progress can mean: the team is waiting for approvals, or additional scan runs are needed after content changes.
Quick actions
Two common actions are directly accessible:
- Create a new project - adds another website project to the workspace.
- Top up tokens - opens the path to increase your balance so scans don't stop because of an empty account.
Typical workflows
Daily check
- KPI row: projects (active/archived), scans (running/failed), token balance (colour of the consumption rate), team (open findings).
- Token consumption: briefly switch the granularity to per week - any outliers?
- For failed scans, jump straight to the scan overview and open the affected job.
Before releases or audits
- Compare current projects and findings progress with the release plan.
- Scans card: are enough runs completed? Does the bar show a lot of red?
- Token balance: if consumption is in the rose range, top up tokens or reduce parallel jobs.
Onboarding new colleagues
- Walk through the onboarding checklist together.
- Use the quick action "create a new project" if the first reference project is still missing.
- Team card: sitemaps and findings badges give a feel for the complexity of the workspace.
Navigation and sidebar
The sidebar links to projects, sitemaps, scan profiles, scans, settings and other modules - depending on your role and the workspace settings.
- The active menu item is highlighted.
- On small viewports the sidebar may be collapsed; open it using the menu icon.
Tips
- Combine KPI cards and token consumption: a sudden spike in the chart often matches many running or newly started scans.
- If numbers don't load, refresh the page or check the network.
- The dashboard doesn't replace detail pages - it just routes you more quickly to the spot that needs action.